Incrementality is the share of your sales that would not have happened without your ads. You measure it by holding back some people or some regions and comparing them with the rest. The catch for many Australian businesses is volume: Meta's guide for its Conversion Lift test is a campaign with at least US$5,000 of spend and 500 conversions.
Platform attribution tells you which ad was present before a sale. An incrementality test tells you whether the ad was needed. This guide covers how the tests work, what the ad platforms offer, how to run a geo holdout yourself, and the weekly volumes a $2M to $20M business needs before a result means anything. It belongs to our wider guide to marketing attribution.
What is an incrementality test?
An incrementality test is a controlled experiment: one group can see your ads, a comparable group cannot, and the difference in conversions between them is the lift your ads caused. The group that sees no ads is the control, also called the holdout.
The groups can be people or places. Platform lift tests split the audience into a test group and a control group, and Meta says its groups are randomised. Geo tests split regions, switch the ads off in some, and compare. Either way, the control shows what would have happened anyway.
One detail is worth knowing. Meta's Conversion Lift compares everyone who was eligible to see the ads with the control group, not only the people who actually saw one, an approach Meta calls intent-to-treat. That keeps the comparison fair, because the people who end up seeing an ad are not a random sample.
What is the difference between A/B testing and incrementality testing?
An A/B test compares versions of your advertising; an incrementality test compares advertising with no advertising. In a Meta A/B test everyone in the test sees an ad, and you learn which version has the lower cost per result. In a lift test part of the audience sees nothing, and you learn how many conversions the ads added.
| A/B test | Incrementality test | |
|---|---|---|
| Question | Which version works better? | Did the ads cause the sales? |
| Groups | Up to five versions; everyone sees ads | Test group sees ads; control group does not |
| Result | Cost per result by version | Incremental conversions, lift and incremental cost per acquisition |
| On Meta | Available to any advertiser | Conversion Lift, with spend, conversion and data-quality minimums |
Source: Meta Business Help Centre, about Experiments, checked 1 October 2026.
How do I calculate incrementality?
Subtract what the control group did from what the test group did, after scaling the control to the same size. The formulas:
- Incremental conversions = test conversions minus scaled control conversions.
- Lift = incremental conversions divided by scaled control conversions.
- Incremental cost per acquisition (iCPA) = ad spend divided by incremental conversions.
- Incremental ROAS (iROAS) = incremental revenue divided by ad spend.
- Incrementality factor = incremental conversions divided by the conversions the platform reported for the same period.
A worked example with illustrative numbers. A 10 percent holdout leaves 90 percent of the audience in the test group, so the control's results are multiplied by nine. The test group records 1,150 purchases and the control records 111, which scales to 999. That is 151 incremental purchases, a lift of about 15 percent. On $30,000 of spend, the iCPA is about $199. At a $150 average order, incremental revenue is $22,650, an iROAS of about 0.76. Meta reported 600 purchases over the same period, a reported ROAS of 3.0, so the incrementality factor is about 0.25: roughly one reported purchase in four was caused by the ads.
The factor is what you use between tests. If it holds near 0.25 and Meta reports a $50 cost per purchase, the incremental cost is about $200, and that is the number to set targets against. Then compare iROAS with your break-even ROAS, which our ROAS and break-even ROAS calculator works out from your margin. Our break-even ROAS by industry benchmarks give a starting point.
Which incrementality tests do the ad platforms offer?
Meta, Google, LinkedIn and TikTok all run lift tests on their own ads, and all set entry requirements that rule out many smaller accounts. Meta charges nothing extra for the test itself.
| Test | How it splits | What you need |
|---|---|---|
| Meta Conversion Lift | People, at random | As a guide, a campaign started in the past year with at least US$5,000 of spend and 500 conversions, prorated beyond 90 days; plus the Conversions API with Event Match Quality above 5, or another supported low-funnel data source |
| Meta Brand Lift | People, at random, then surveyed | At least US$120,000 of ad spend in the past 90 days; measures brand metrics, not sales |
| Google Conversion Lift based on users | People | Not open to every account; arranged through your Google account team. At least 1,000 observed conversions and a campaign budget of at least US$5,000 |
| Google Conversion Lift based on geography | Regions | Arranged through your Google account team; usually needs a bigger budget than the users-based test |
| LinkedIn Conversion Lift Testing | Audience split into test and control | LinkedIn's Conversions API or Insight Tag in place; runs 30 to 90 days; the campaigns in the test must together meet LinkedIn's $80,000 minimum budget |
| TikTok Conversion Lift Study | Audience split into test and control | A managed service for eligible accounts, set up with TikTok's account team; minimum spend depends on the objective and scope; TikTok recommends its Events API as the data source |
Sources: Meta Business Help Centre, about Conversion Lift and about Experiments; Google Ads Help, set up Conversion Lift based on users and comparing lift types; LinkedIn Marketing Solutions Help, Conversion Lift Testing requirements; TikTok business help, about Conversion Lift Study. Checked 1 October 2026.
Two open-source tools cover the do-it-yourself route. Meta's GeoLift is an R package for geo experiments built on synthetic control methods, with power calculations to help choose test regions. Google's Meridian GeoX runs geo experiments designed to calibrate Google's Meridian marketing mix model.
The requirements also show why clean data comes first. Meta's self-serve Conversion Lift needs the Conversions API at a match quality score above 5, and Google recommends enhanced conversions before a lift study. Our Meta Conversions API guide covers getting there.
How does a geo holdout test work?
A geo holdout switches a channel off in some regions, keeps it running in comparable ones, and compares sales between them over a set period. It needs nothing from the platform except location settings, and it measures sales in your own records, so it picks up effects no platform can see, such as people who saw an ad and later walked in or rang.
- Choose the outcome. Orders, booked jobs or qualified leads, recorded by postcode or suburb in your own system rather than the ad platform.
- Divide the market into many small regions. Groups of postcodes or towns work better than whole cities.
- Assign regions to test and control, at random or with a matching method, and check that the two groups tracked each other closely over the previous months.
- Check the test's power before you start, using your own weekly numbers (see the next section).
- Switch the channel off in the control regions with each platform's location exclusions, and change nothing else while the test runs.
- Run for at least two full weeks and at least one normal sales cycle, then compare the test regions with what the control regions predict.
Australia makes the design harder than it looks. Greater Sydney and Greater Melbourne each had more than 5.4 million residents at June 2025, about 40 percent of the country between them, and the capital cities held about two-thirds of all Australians. No other region is a close match for Sydney, so a test that pits Sydney against Brisbane compares two different markets, not ads against no ads. Split within states instead, keep a city and its commuter belt in the same group, and avoid weeks when public holidays or school holidays fall in only some of your regions.
Population figures: Australian Bureau of Statistics, Regional population, 2024-25 and National, state and territory population, June 2025.
Can a $2M to $20M business run a valid test?
Often, but not always, and the deciding number is conversions per week in the outcome you will measure. The table shows the smallest lift a test could detect in the best case, counting only the random noise in the conversion counts themselves. Real geo tests are noisier, because regions differ from each other, so treat these figures as a floor rather than a target.
| Conversions a week, all regions | Smallest lift a six-week test can detect | Weeks needed to detect a 10 percent lift |
|---|---|---|
| 25 | 51% | 132 |
| 50 | 35% | 66 |
| 100 | 24% | 33 |
| 250 | 15% | 14 |
| 500 | 11% | 7 |
| 1,000 | 7% | 4 |
| 2,000 | 5% | 2 |
Profit Geeks calculation, October 2026: test and control split 50/50, a two-sided test at 95 percent confidence and 80 percent power, and Poisson noise in the counts only. Weeks are rounded up.
How to read it: if a channel should add 10 to 15 percent to sales, you need roughly 250 to 500 conversions a week to see it within six weeks. Below that, the test will usually come back with no significant difference, which is not the same as no effect.
Across the band, that plays out like this:
- Ecommerce. An $8 million store with a $160 average order takes about 50,000 orders a year, or roughly 960 a week. In the best case, a six-week test could detect a lift as small as about 7.5 percent.
- High-ticket services. A $5 million business with a $4,000 average job books about 1,250 jobs a year, or 24 a week. A six-week test on booked jobs could only detect a lift of about 50 percent. Test on a stage with more volume, such as qualified leads, and be clear that you are measuring leads, not sales.
- Meta's self-serve test. Its guide of 500 conversions in a campaign over about 90 days works out to roughly 39 a week, so many service businesses miss it on the conversion that matters and clear it only on leads.
Volume is not the only condition. A valid test also needs:
- A channel expected to move sales by more than the smallest lift you can detect.
- A sales cycle that fits inside the test, or an earlier stage that does.
- No other change during the test: no big promotion, price change, launch or new channel.
- Sales recorded by location in a system the ad platforms do not control.
- A cost you can accept. Switching a channel off in half your regions gives up half of whatever that channel truly adds for the length of the test, offset by the media you do not buy.
If any of these is missing, do not run the test yet. A test that cannot detect the effect you care about costs money and produces a result people will over-read.
Does MMM measure incrementality?
Marketing mix modelling estimates each channel's incremental contribution, but from history rather than an experiment, so on its own it is an estimate, not a measurement. The open-source models are built to be checked against experiments. Meta's Robyn documentation describes calibrating the model with results from randomised tests to bring causality into it, and Google's Meridian GeoX turns geo experiment results into inputs for Meridian.
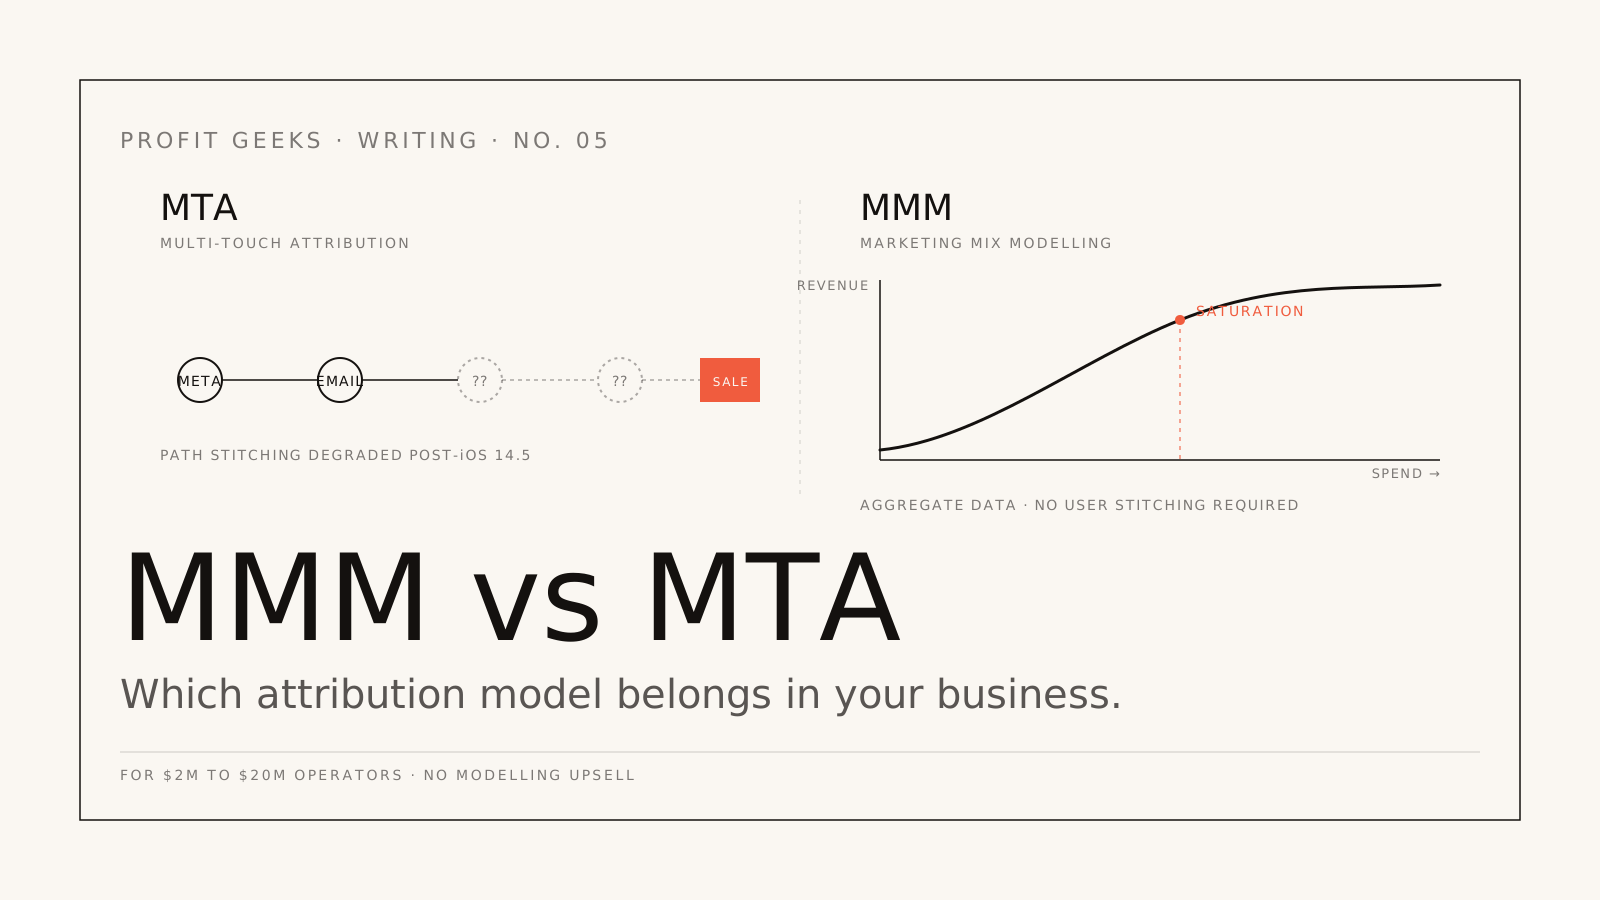
For most businesses in the $2M to $20M band, formal MMM costs more than it returns. As we set out in our guide to MMM vs MTA and marketing mix modelling, it rarely pays back below about $250,000 a month in ad spend. The practical stack at this size is clean platform data reconciled to your own sales each month, plus an incrementality test on the channel you are least sure about whenever your volumes allow it.
How should you act on a result?
- Turn the factor into targets. Multiply platform-reported conversions by the incrementality factor and set cost targets on the result.
- Compare iROAS with break-even ROAS. If incremental ROAS sits below the ROAS you need to break even on margin, the channel is losing money however good the platform report looks.
- Treat one test as one reading. Results move with season, creative and spend. Re-test after big changes. A heavy-up test, with more spend in the test regions, answers a different question from a switch-off test: what the next dollar returns, rather than what the current spend returns.
- Write the design down first. Record the outcome, regions, dates and decision rule before anyone sees results, so nobody moves the goalposts afterwards.
Where to go next
An incrementality test is only as good as the conversion data behind it, which is why the measurement comes first. The marketing attribution hub sets out how the pieces fit, and our tracking audit checks whether your data is ready for a test. To talk through a test design on your own numbers, book a free 30-minute profit audit.
Next step
Want this kind of work in your business?
Engagement intake is capped, senior operators run every account. If your attribution is leaking and your reports have stopped making sense, the next step is a 30-minute call.